Click here to get instructions…
- Please download and unzip the replication files for Chapter 4 ( Chapter04.zip).
- Read
readme.htmland run4-0_ChapterSetup.R. This will create4-0_ChapterSetup.RDatain the sub folderdata/R. This file contains the data required to produce the plots shown below. - You also have to add the function
legend_large_boxto your environment in order to render the tweaked version of the legend described below. You find this file in thesourcefolder of the unzipped Chapter 4 archive. - We also recommend to load the libraries listed in Chapter 4’s
LoadInstallPackages.R
# assuming you are working within .Rproj environment
library(here)

# install (if necessary) and load other required packages
source(here("source", "load_libraries.R"))

# load environment generated in "4-0_ChapterSetup.R"
load(here("data", "R", "4-0_ChapterSetup.RData"))
In chapter 4.1, we introduce crisp/hard clustering algorithms and cluster quality indeces to be considered when making decisions on the number of clusters to extract from the initial sample. The data come from a sub-sample of the German Family Panel - pairfam. For further information on the study and on how to access the full scientific use file see here.
Crisp (or hard) clustering algorithms
We apply a hierarchical cluster analysis by using the command
?hclust to the dissimilarity matrix
partner.child.year.om for the family formation sequences,
computed based on OM with indel=1 and sm=2. We
use non-squared dissimilarities (see the method option) and
weights (see the members option, where we have to specify
to which data.frame the vector with the weights belongs
to).
fam.ward1 <- hclust(as.dist(partner.child.year.om),
method = "ward.D",
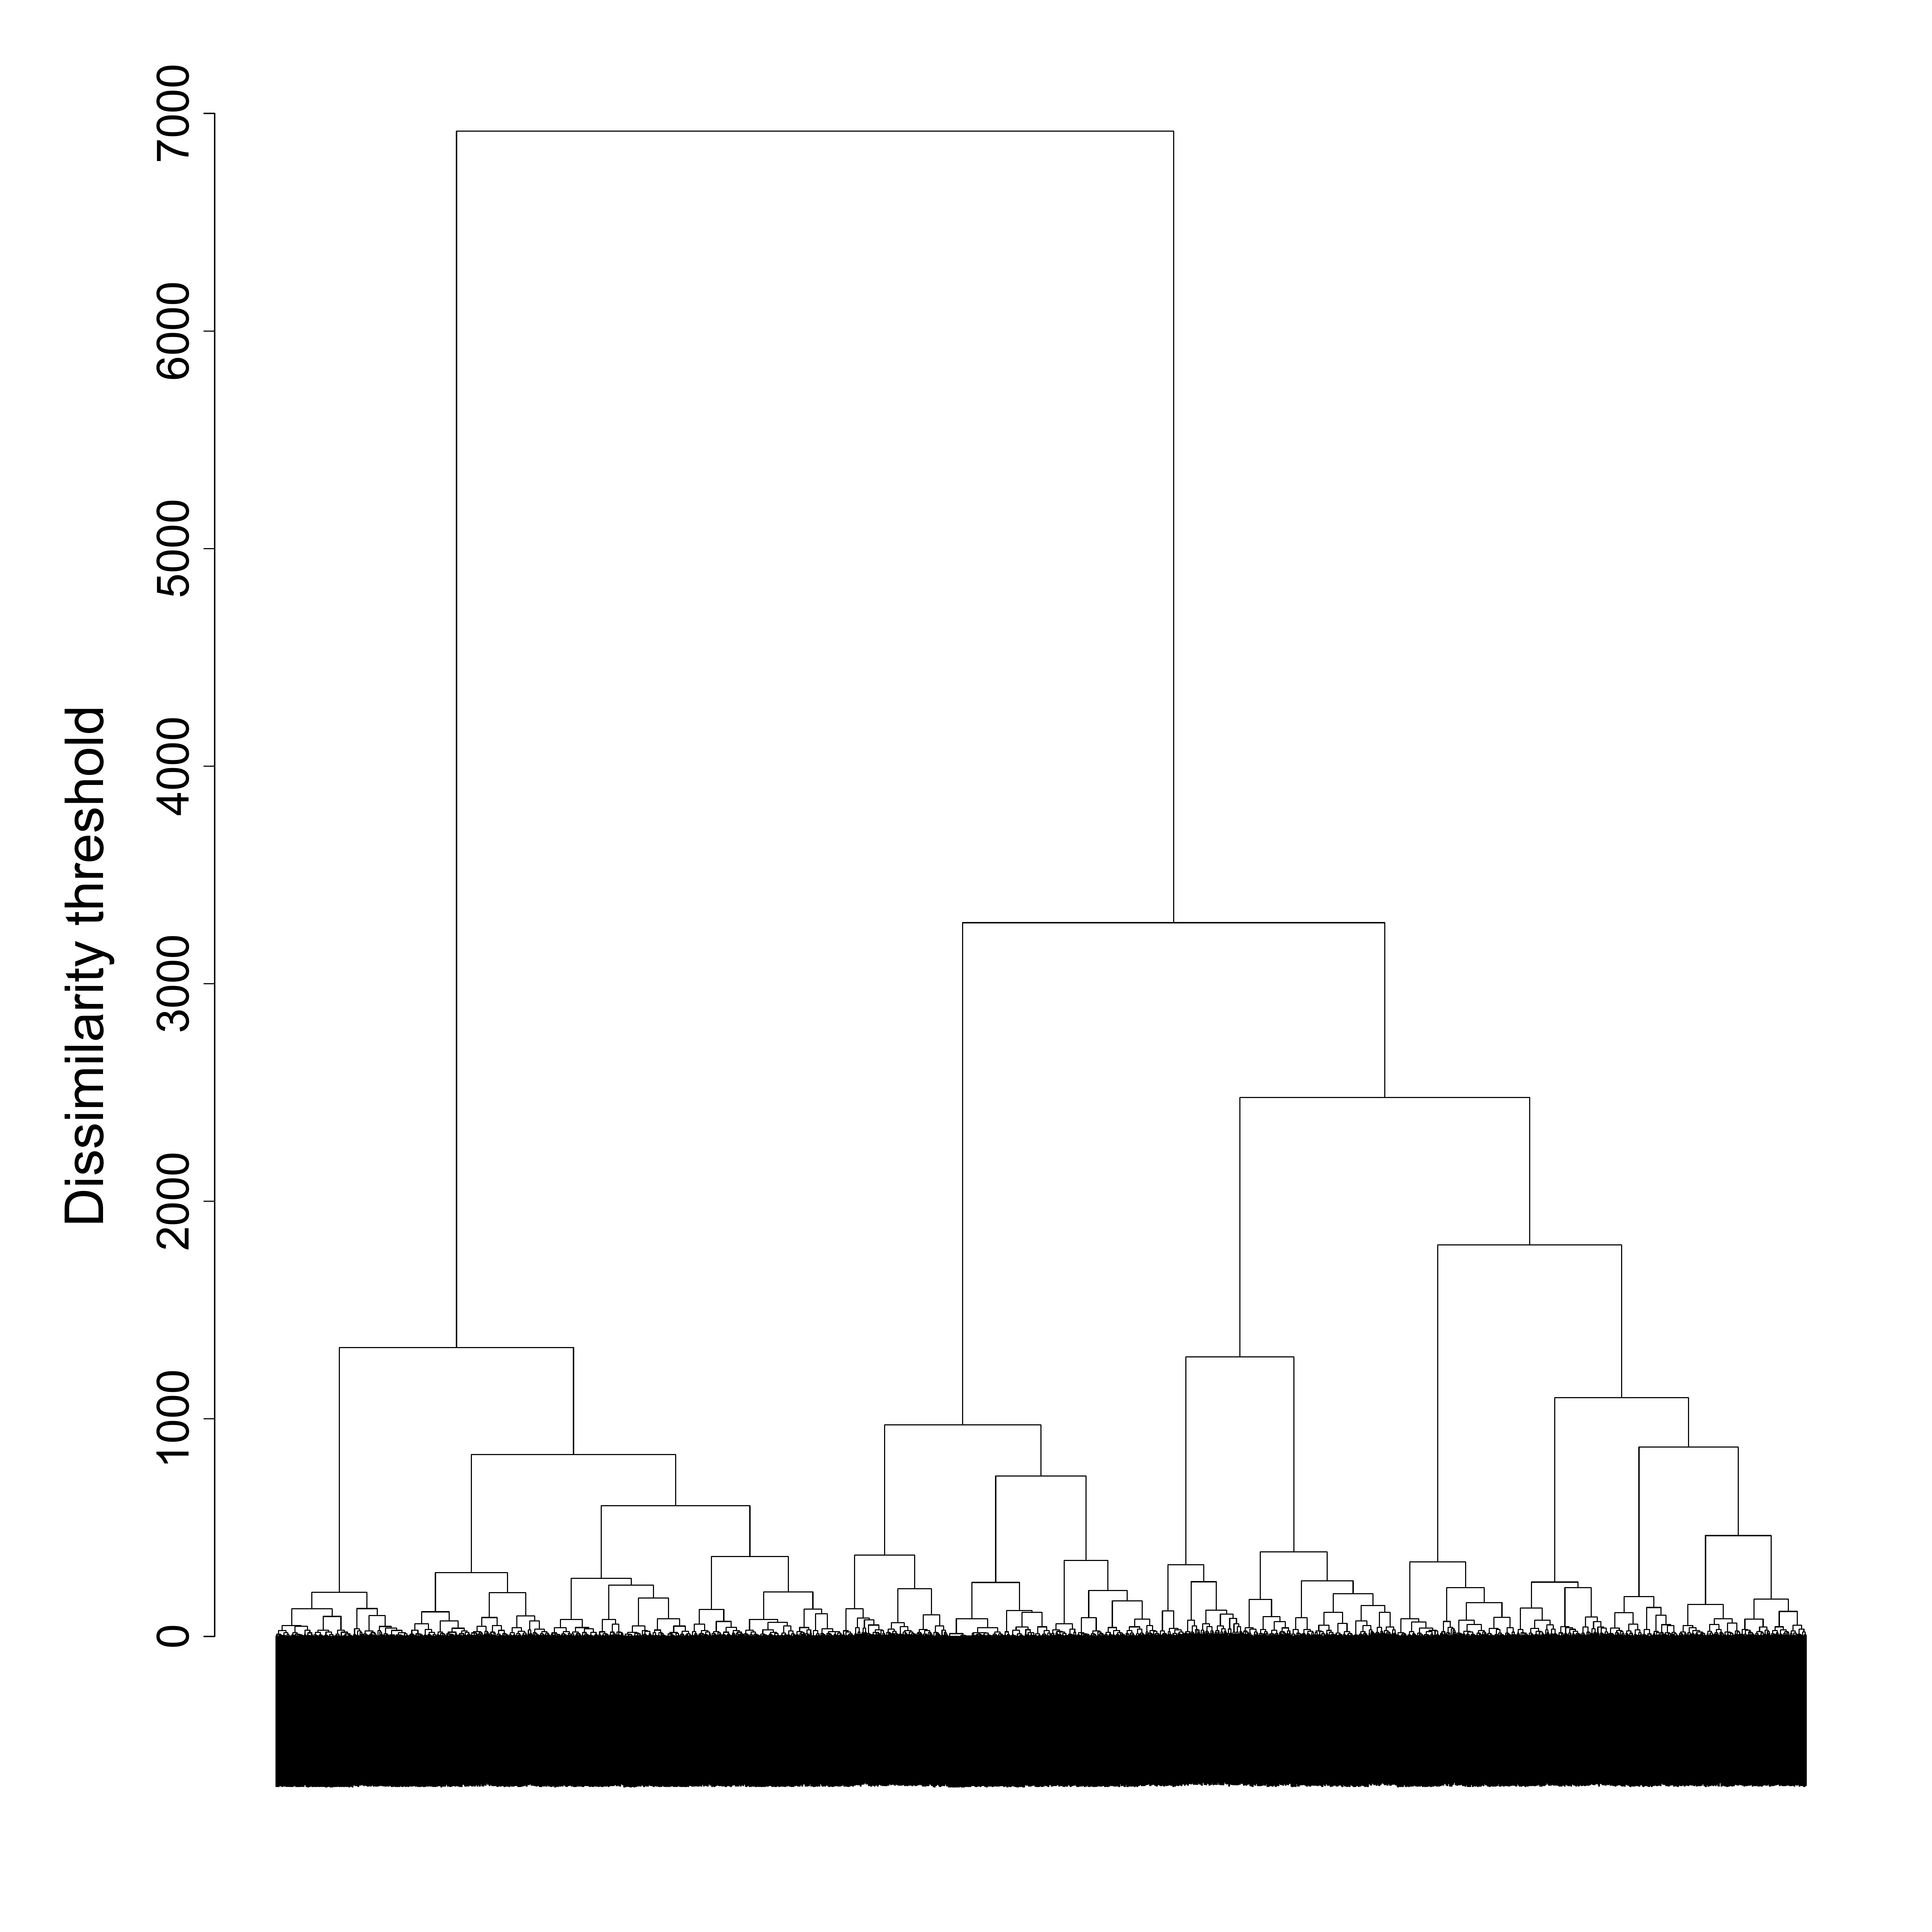
members = family$weight40)The nested structure emerging from the hierarchical clustering algorithm can be displayed using a dendrogram:
par(mar = c(3, 10, 3, 3))
plot(fam.ward1, labels = FALSE,
     main ="",
     ylab="",
     xlab="", sub="",
     cex.axis=2.5,
     cex.lab=2.5)
mtext("Dissimilarity threshold", side = 2, line = 5, cex = 3)

dev.off()